Implementing product analytics
A guide for engineers to make analytics implementation simple and accessible
- Introduction
- 1. Collection first, everything else follows
- 2. Analytics is simple. It is four scopes.
- Agree on terminology
- Implement analytics in codebase
- Make status quo accessible
- Stream data into analysis tool
- Make analysis a habit
Introduction
Implementing product analytics within an application can be really easy! What I have experienced however: Mostly engineers can not relate to analytics and often view it as an unnecessary burden.
They say:
It doesn’t “improve” the product.
Its “overhead” work.
Are we even analyzing what we’re tracking?
And this is totally understandable since such analytics efforts are often pushed from business / growth / pm stakeholders. However, analytics can be really beautiful and effortless for everyone if these two aspects are understood for everyone and in particular engineering:
Collection first, everything else follows
Analytics is simple. It is four scopes.
1. Collection first, everything else follows
View decision making through data as a simple sequence of Collect, Process, Analyse, Evaluate. We collect user interactions from our product, we process that data into some storage and analysis tool, we build analyses on top of that data and we then act upon that data by interpreting it and making new product decisions.

Understanding the importance of doing step 1 right, is crucial. Collecting data reliably and efficiently at scale is a non-negotiable when using data to learn from your users.
2. Analytics is simple. It is four scopes.
A user has sessions. User interactions within a session are called events. Event details are captured via properties. This really is all we need to implement analytics.
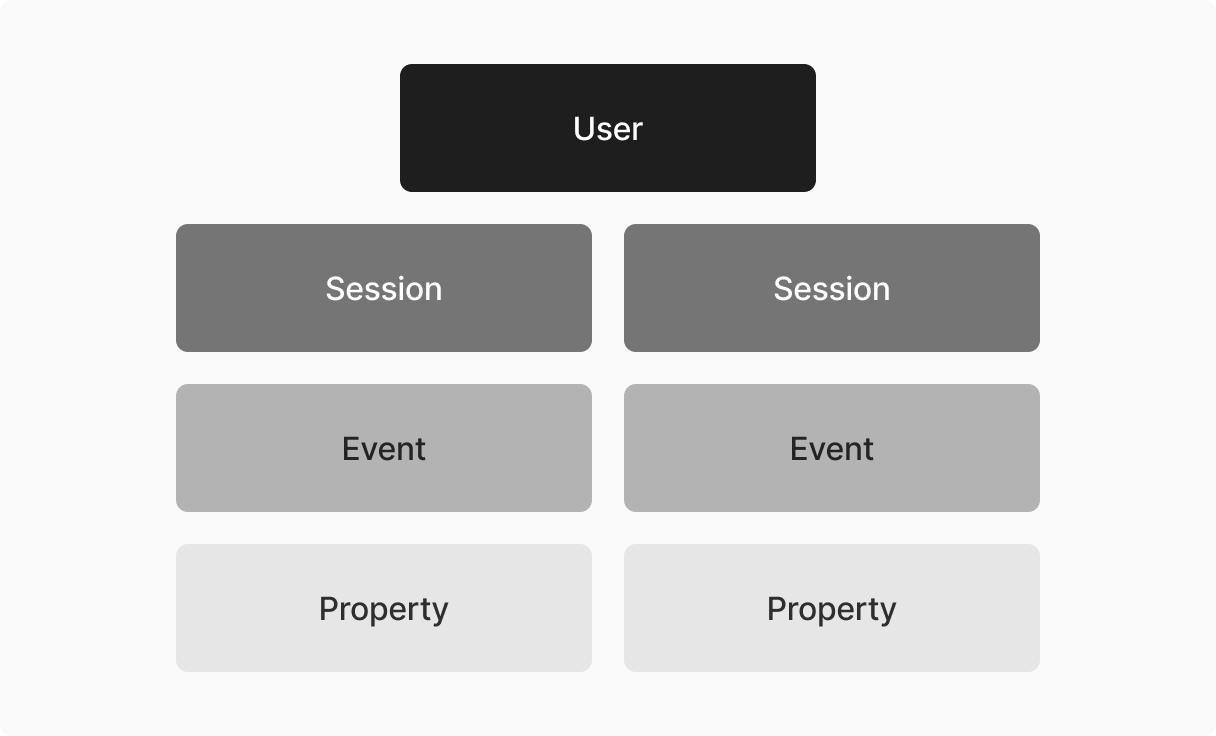
Here is what you should do to get started with analytics easily:
Agree on terminology
Add events to codebase
Make status quo accessible
Stream data into analysis tool
Make analysis a habit
(In the following I will use the Twilio Segment analytics library as an example. However the concepts, patterns and ideas can really be applied to any application that users interact with.)
Agree on terminology
Defining naming conventions for all events to be tracked is crucial. When thinking about product usage, a user always interacts in a certain way with an object. An object-action notation comes in handy here.

Here are some good examples:
Page Viewed
Product Clicked
Email Entered
Order Completed
Document Uploaded
Its important to be precise about the terminology. Here are some bad examples:
page-viewed
click product
email entered
orderCompleted
upload
Make sure to also align on a convention for event properties.
Create reusable objects that follow the same schema (here “product”) if used in multiple events
Create a “properties” object. This way your custom properties are clearly separated from default properties tracked by the analytics library.
eventName: "Product Clicked",
properties: {
	position: 3,
	product: {
		brand: "...",
		price: 34,
		isDeal: false,
	}
}
Implement analytics in codebase
Add Analytics Library
Add an analytics library of your choice (or even your own) to your codebase.
An implementation could look like this:
//at app root level (like layout.tsx or _app.tsx)
...
<Script
  dangerouslySetInnerHTML={{
    __html: loadSegment(),
  }}
  id="segmentScript"
/>

...

const loadSegment = () => {
  const options = {
    apiKey: process.env.NEXT_PUBLIC_SEGMENT_WRITE_KEY,
    page: false,
  };
  if (process.env.NEXT_PUBLIC_NODE_ENV) {
    return snippet.max(options);
  } else {
    return snippet.min(options);
  }
};

...
Add tracking events
Data is captured by implementing function calls (usually Javascript) into the application. These function calls are provided by analytics libraries for the client and the server and can be segmented into
page()
track()
identify()
page()
A page call is fired whenever a user views a page.
An implementation could look like this:
//utils/tracking.ts

...
export const pageEvent = (url: string) => {
  window?.analytics?.page(url);
};
...

//at root app level

...

useEffect(() => {
    if (router.isReady) {
      pageEvent(path);
    }
  }, [path, router.isReady]);

...
track()
A track call is fired whenever a user does a certain action.
An implementation could look like this:
//utils/tracking.ts

...
export const trackEvent = (eventName: string, properties?: Object) => {
  window?.analytics?.track(eventName, { ...properties });
};
...

//some landing page

...
<Button
  onClick={() =>
    trackEvent("CTA Clicked", {
      location: 'hero',
    })
  }
>
  See all products
</Button>
...
Tipps:
Move all custom properties into a properties object. (This makes it easier to access to properties in the analysis tool later)
Create reusable nested objects (e.g. when a product object is used in multiple events, ensure it follows the same schema)
identify()
A identify call is fired whenever there is new information about a user.
//utils/tracking.ts

...
export const identifyEvent = (properties?: Object) => {
  window?.analytics?.identify({ ...properties });
};
...

//at root app level or anywhere where there is new information

...
useEffect(() => {
    identifyEvent({
      featureFlags: {
        ...getFeatureFlagsFromCookies(),
      },
    });
  }, []);
...
Tipps:
Call identify on first app render to identify potential feature flags for user.
Ensure that the identify call is the very first event! (Before any track calls)
Make status quo accessible
Especially when working in larger teams or organizations its important to democratize access to what the application is tracking. There’s no point in investing in analytics if only a handful of selected people know whats implemented, know how to build analyses on that data and know how to derive meaningful conclusions.
Here are a couple of tips to make the implementation accessible:
Tracking Event Plan
Keep a list of all added events in the codebase. For example create a TRACKING_EVENTS enum.
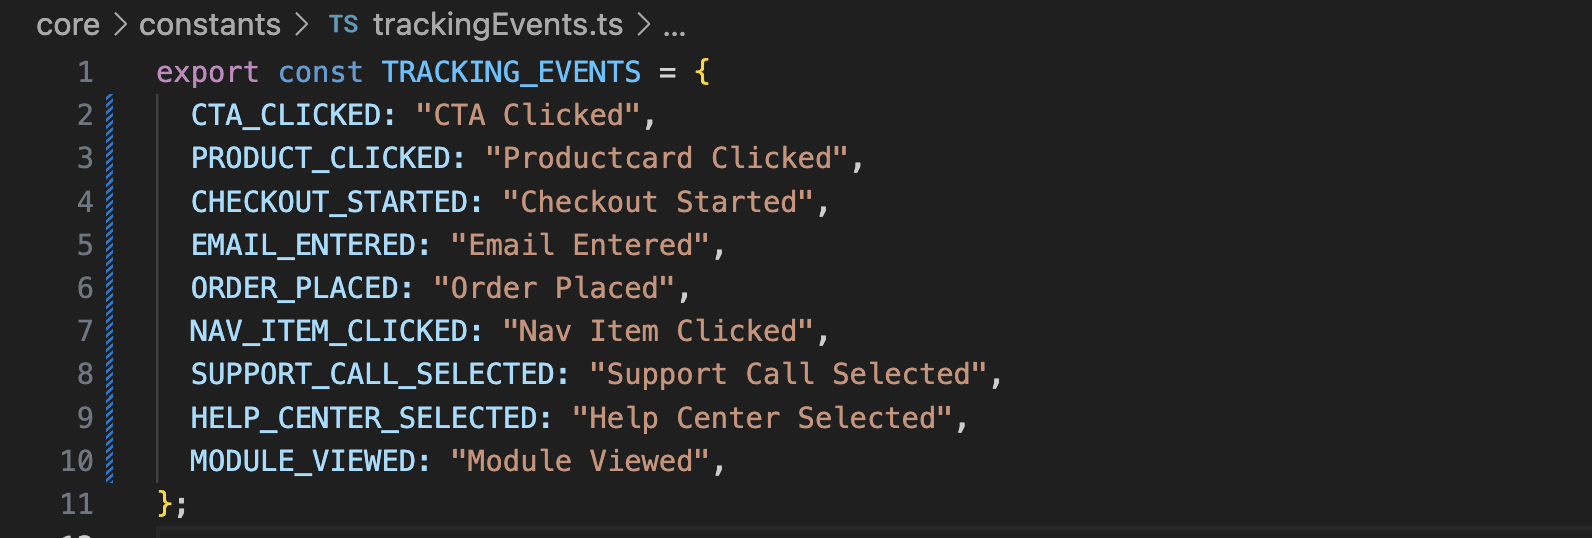
Then, access that enum in your events instead of hardcoding the string values.
...
<Button
  onClick={() =>
    trackEvent(TRACKING_EVENTS.CTA_CLICKED, {
      location: 'hero',
    })
  }
>
  See all products
</Button>
...
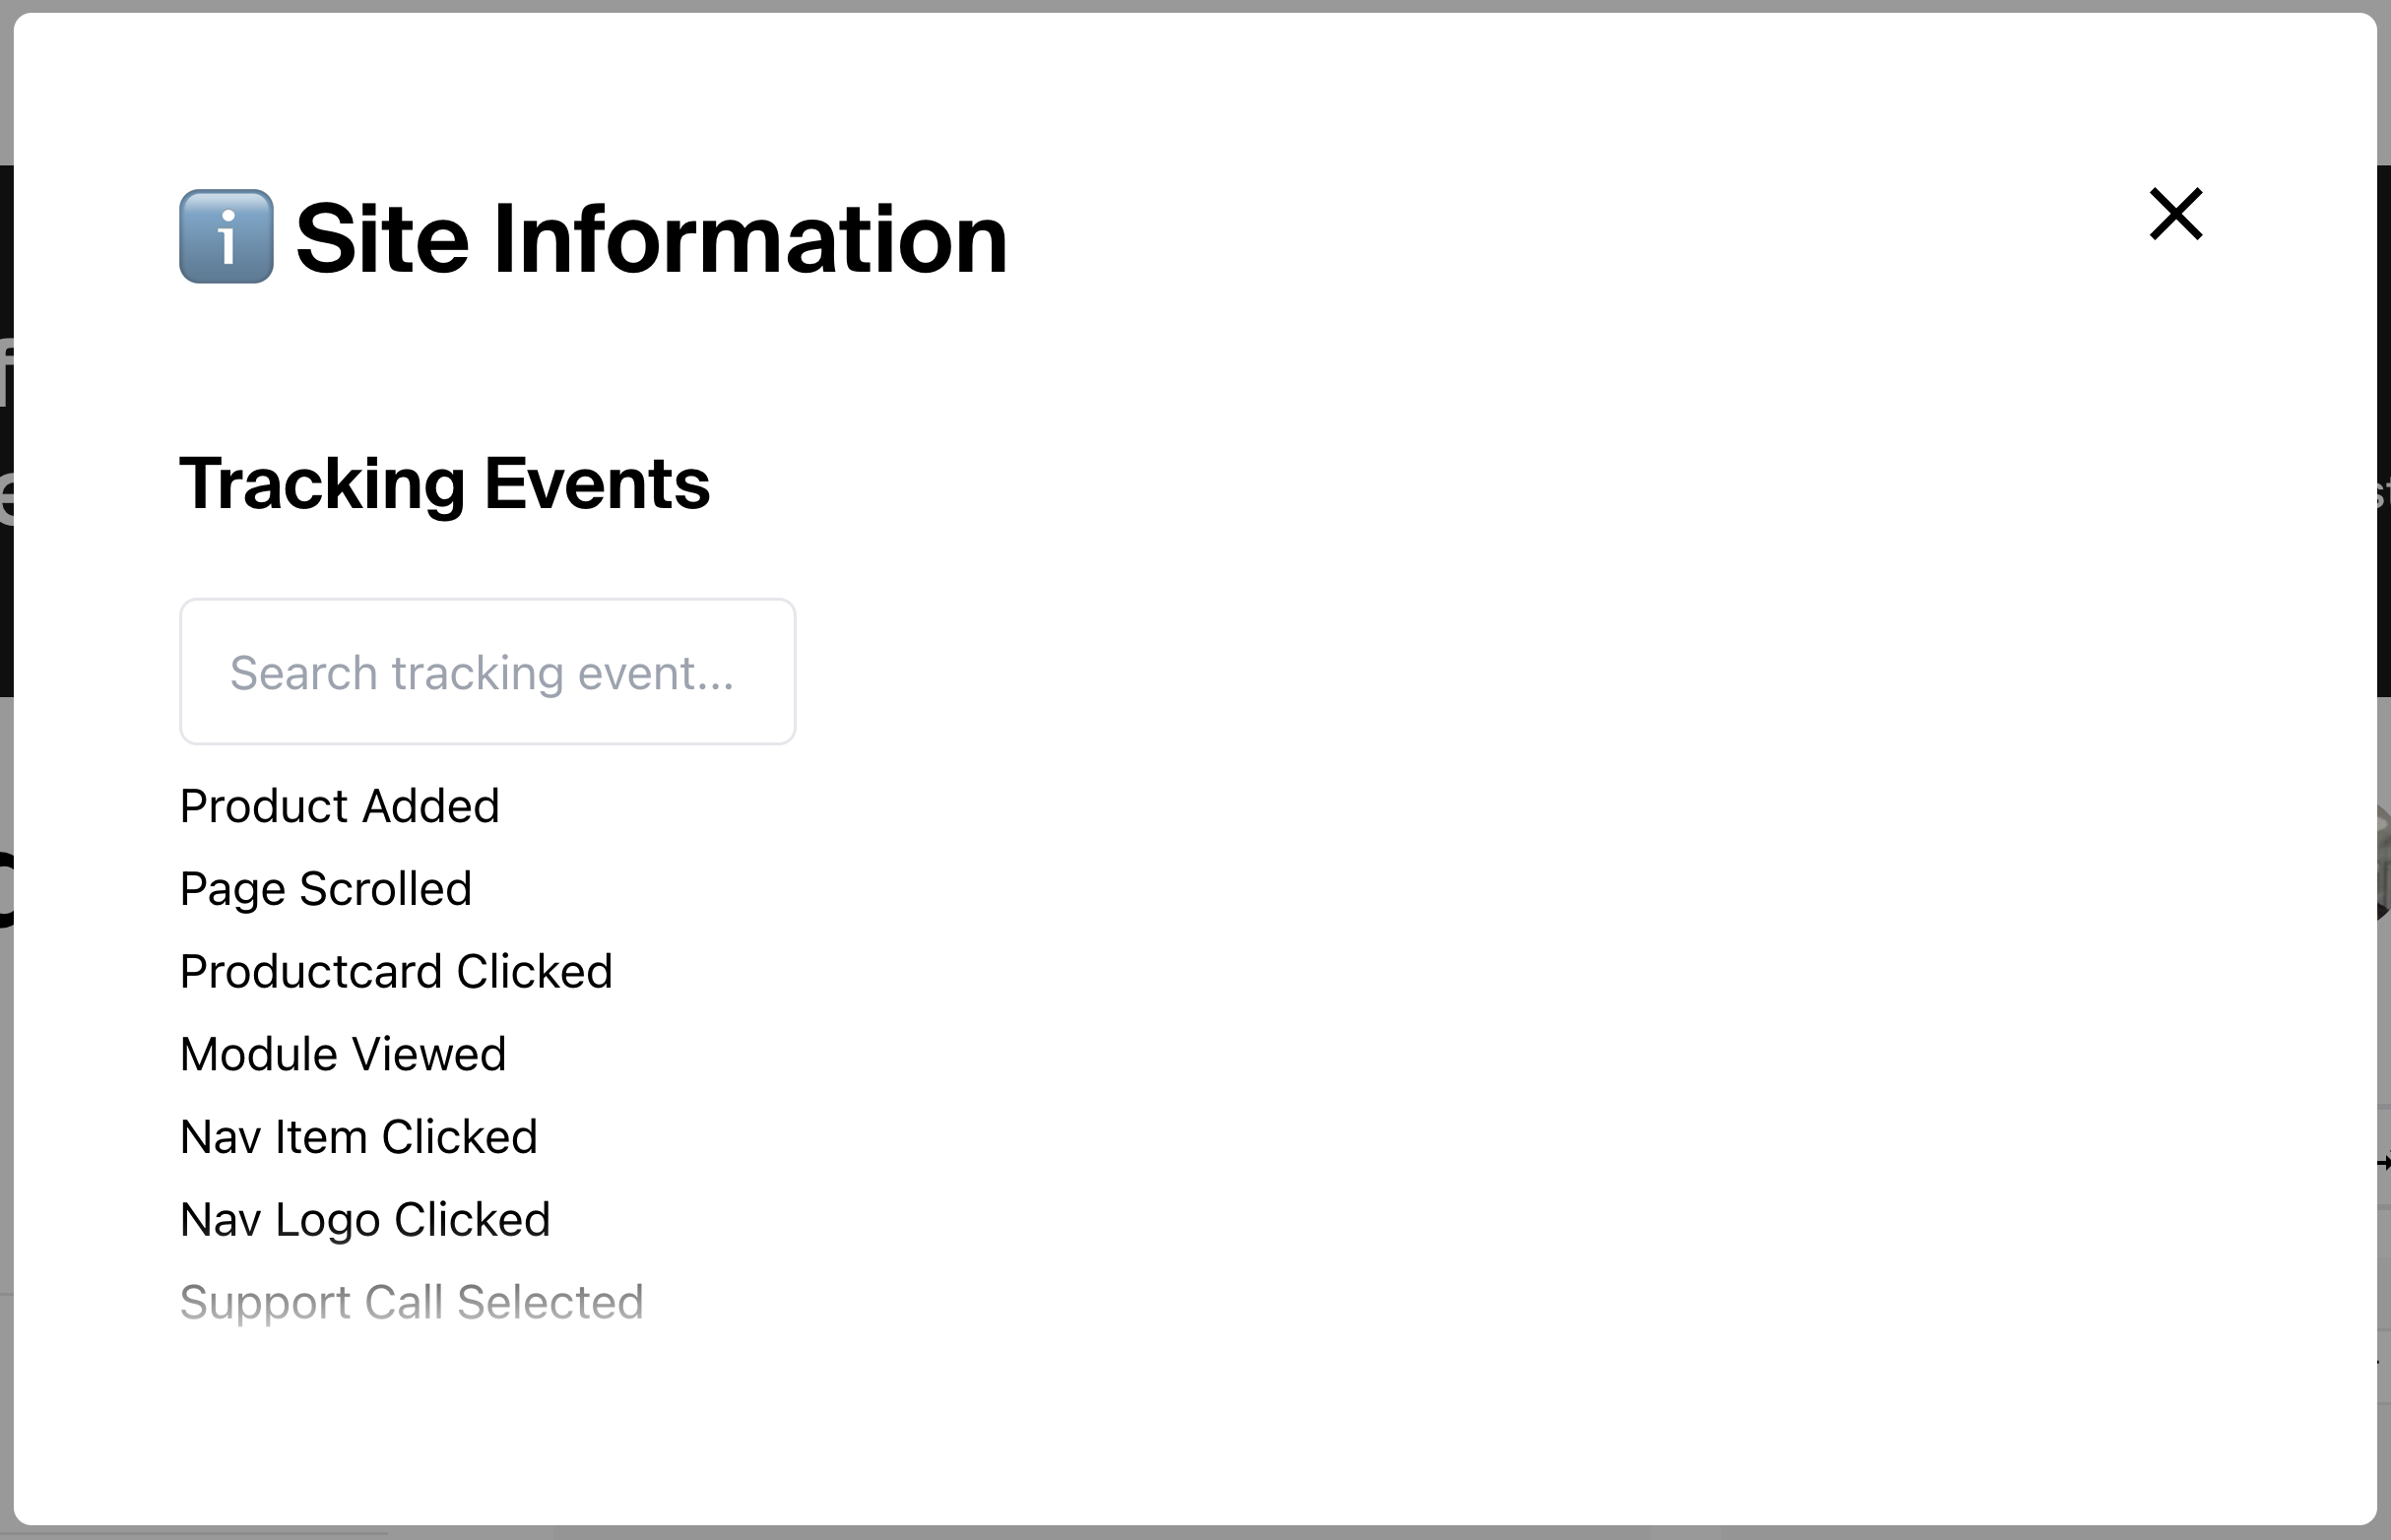
This enum, makes it easy to export that list. Render the list into a team/organization internal view. This way your team mates can always come back and check whats implemented and whats not.
Event Toast Notifications
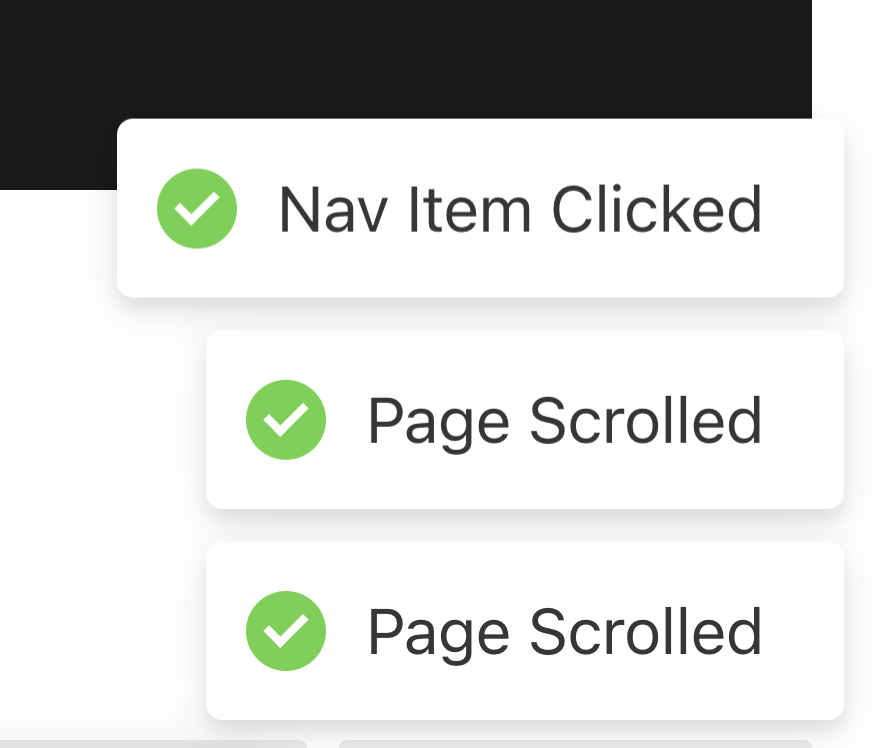
In development and staging environment let your team mates see which events they are firing. Do this, by displaying a toast whenever an event gets fired.
...
export const trackEvent = (eventName: string, properties?: Object) => {
  window?.analytics?.track(eventName, { ...properties });

	//show event popup in dev mode
  if (process.env.NODE_ENV == 'development') {
    toast.success(eventName);
  }
};
...
This makes the implementation extremely visible and event flows can better be traced and understood. There’s nothing worse than launching an experiment or feature and then realizing that crucial events are missing or firing incorrectly.
Stream data into analysis tool
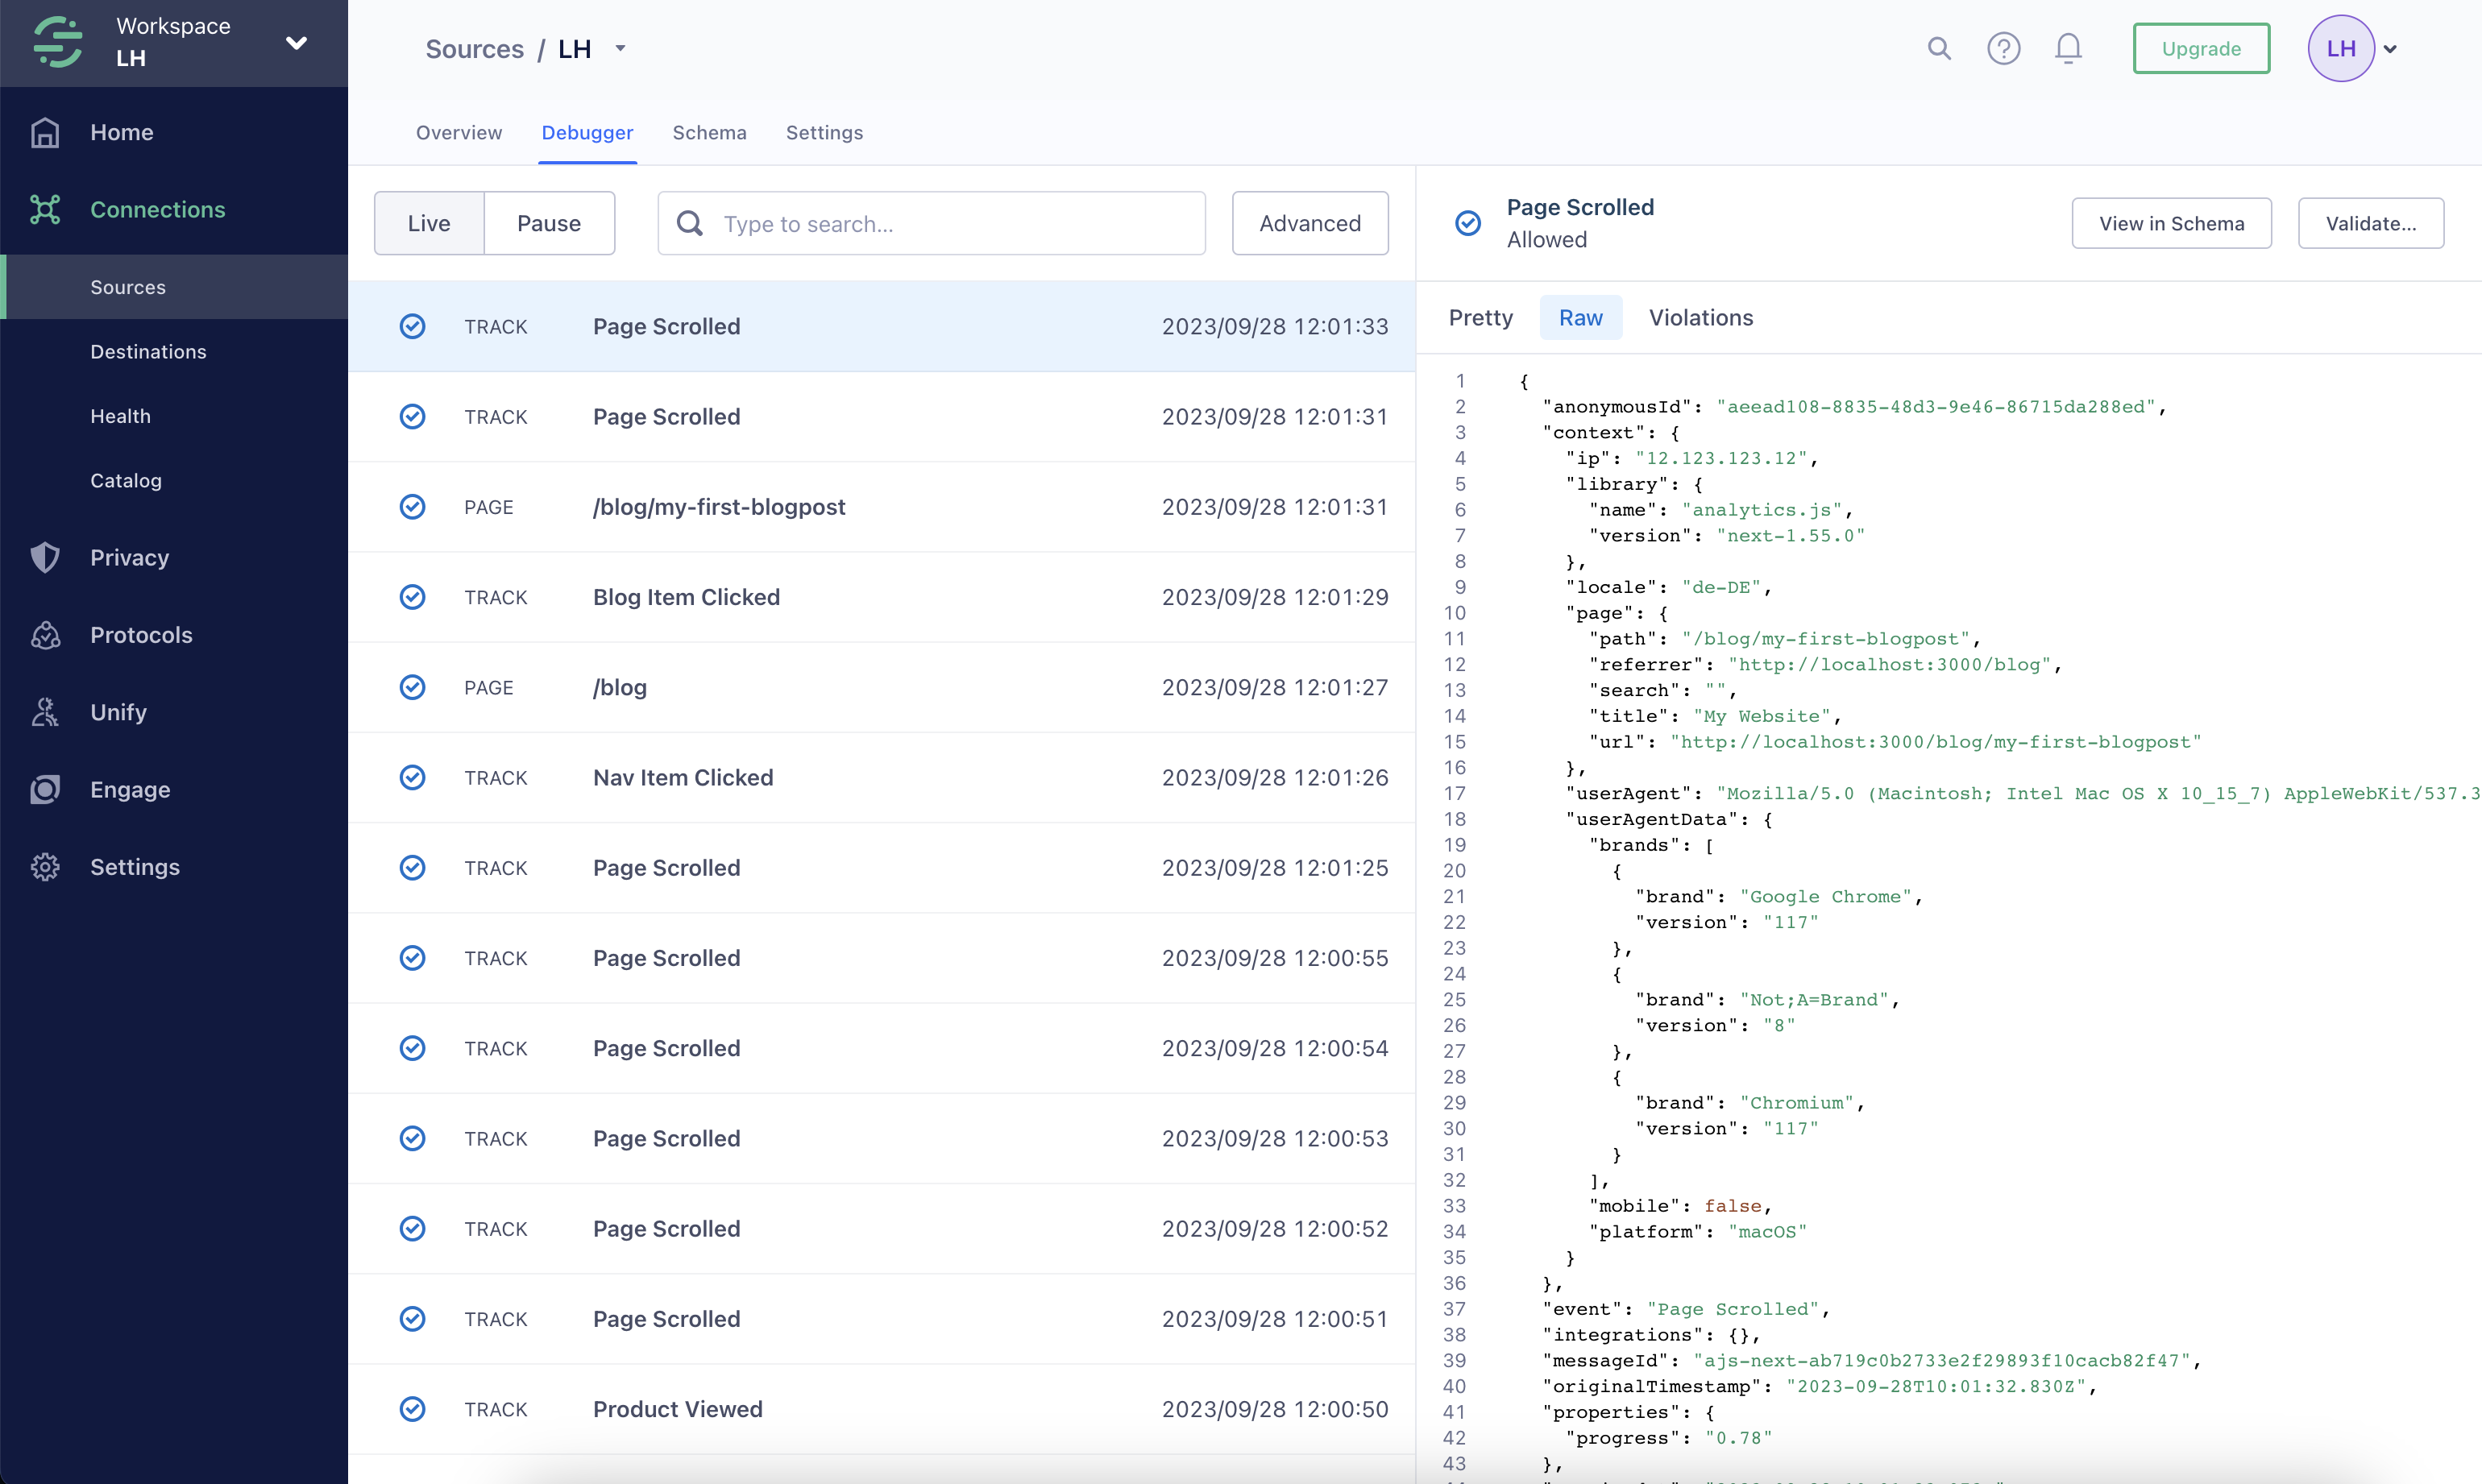
Lets recap a typical product analytics data flow. Once data is collected it needs to be processed and then analysed.
First, ensure that your data is sent correctly to your data processing API (in this case Twilio Segment as well)
Make analysis a habit
Your left with nothing if such an analytics setup is built once and then never evolves further. To really bake analytics into your product development process and decision making and to strive for continuous evidence-based improvements you’ll need to make sure there is a lightweight process in place. This encompasses:
Adding further events to the codebase
Analysing data and deriving insights
1. Adding further events to codebase
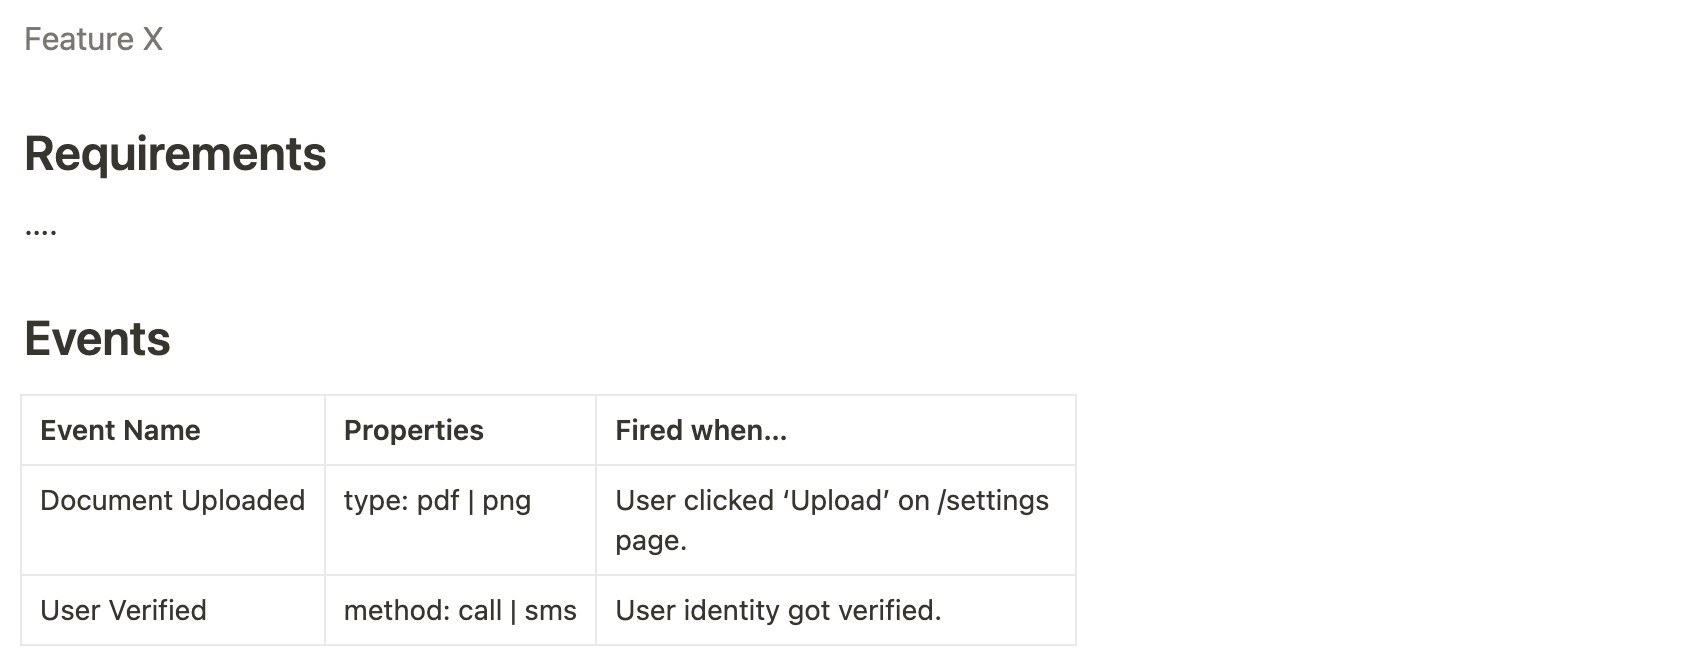
Instead of defining discrete dates at which you’ll enhance your data orchestration, make it a natural part of your everyday product and software development. A good idea could be to always add an “Events” section to your feature spec.
2. Analysing data and derives insights
This is the practice of observing. From observation come findings. From findings come insights. Those insights help in fueling new hypotheses.
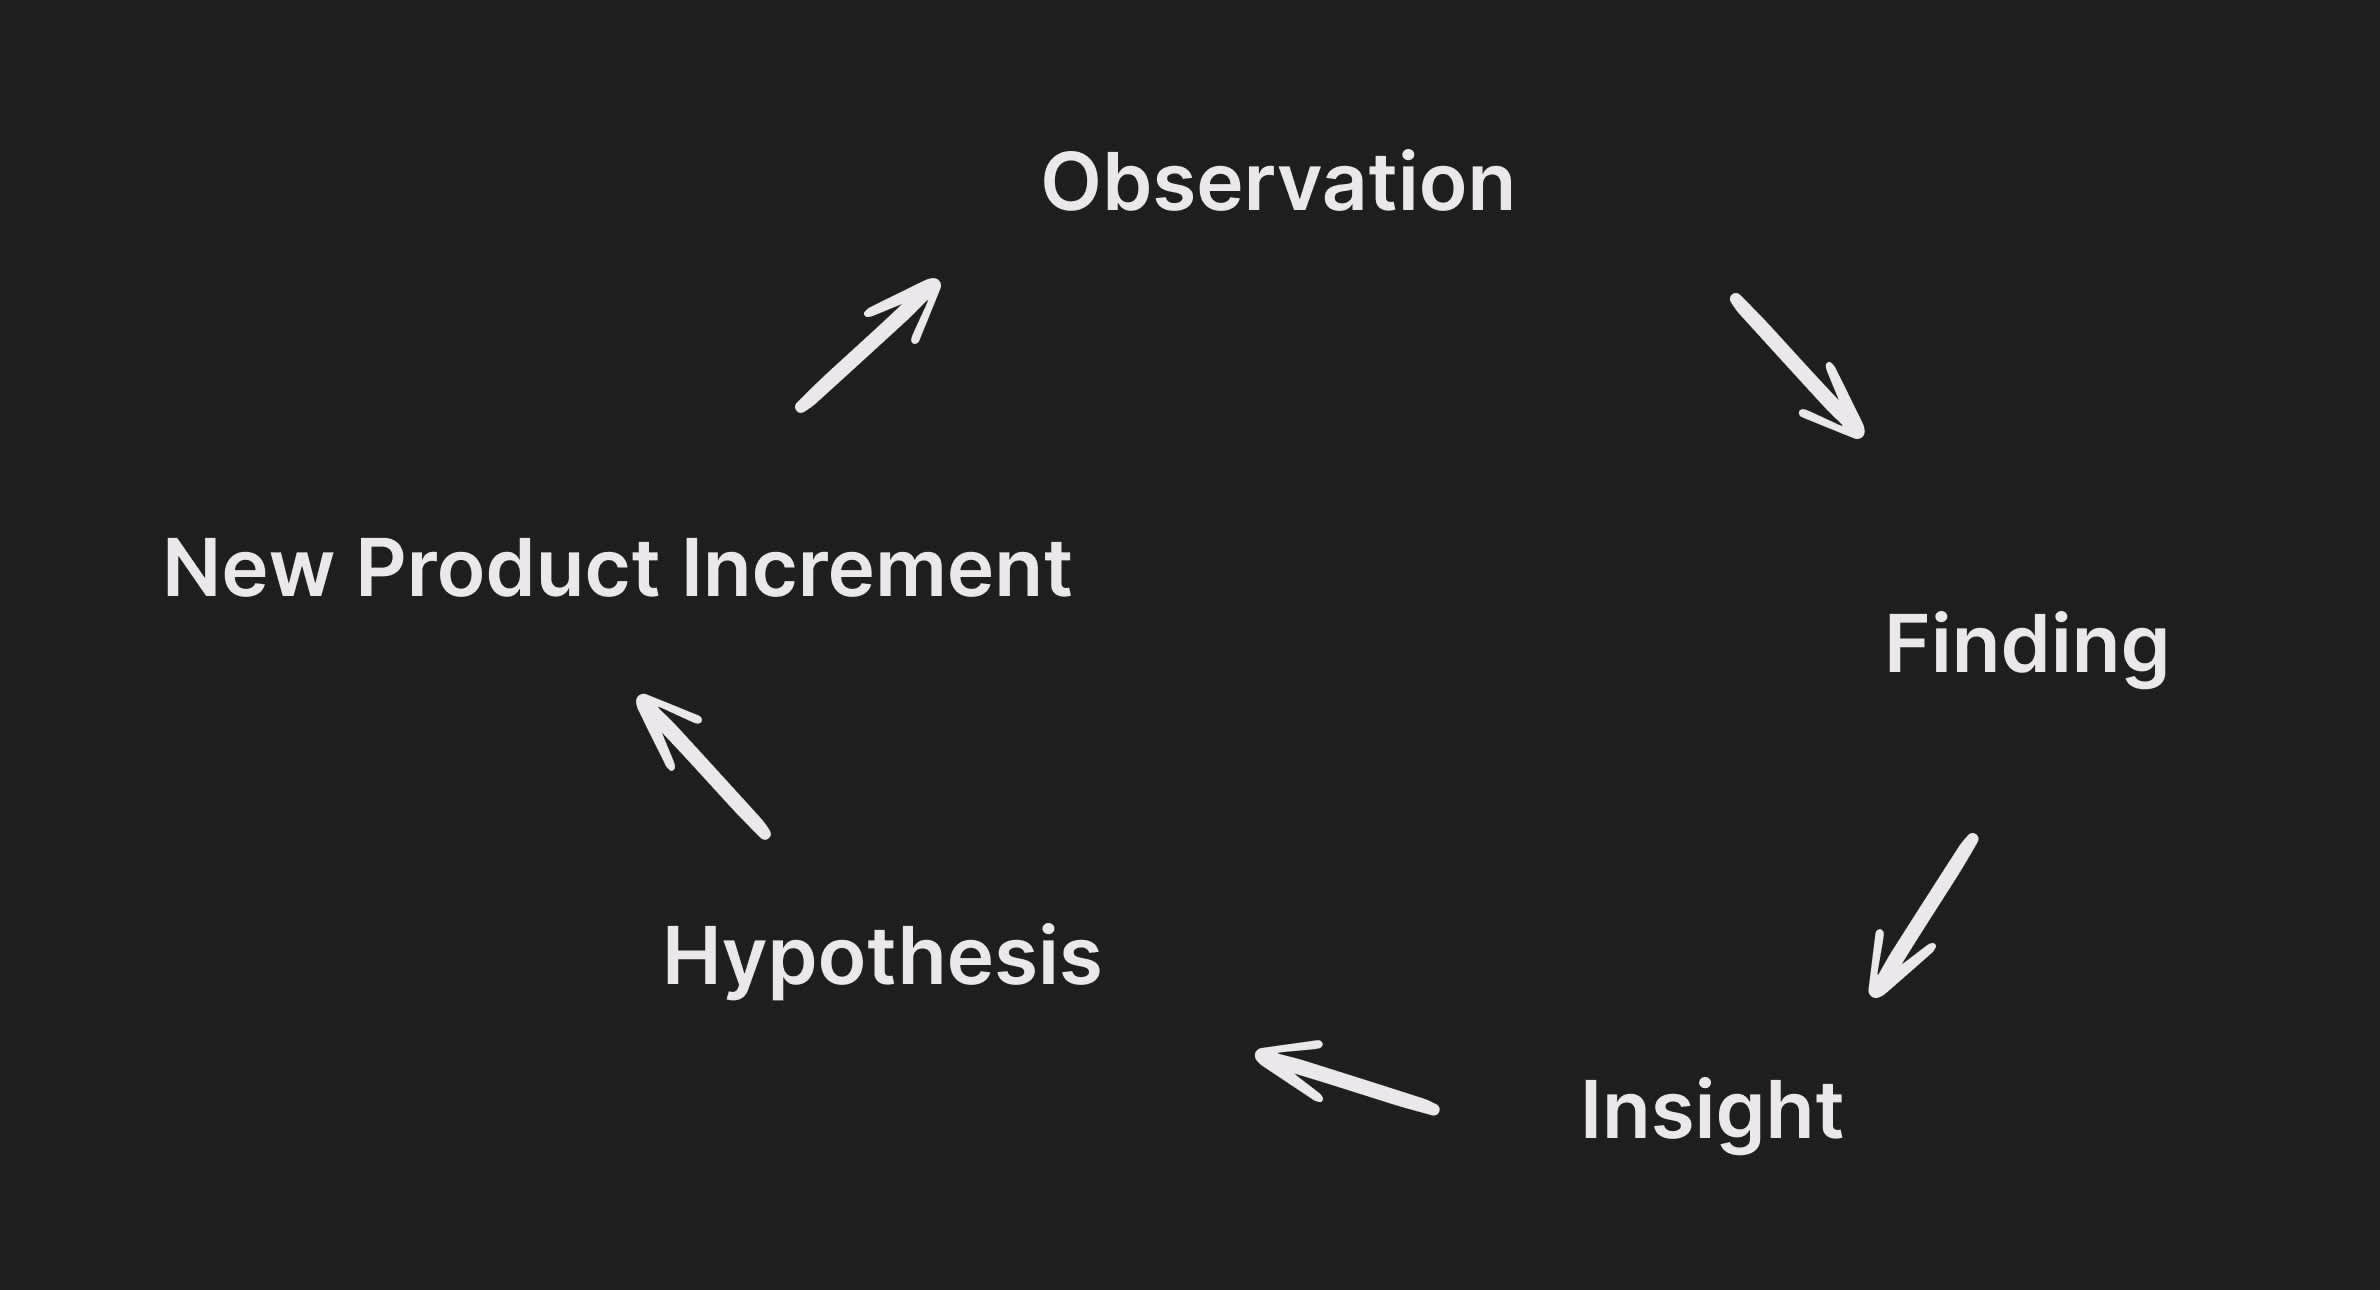
Observing what your users are doing fuels subsequent product decision process. Hence, make sure that you practice it regularly. Here are some ideas:
Schedule weekly “analytics ”:
Look at the data together. Identify anomalies and general trends and make interpretations.
Share dashboards:
Carefully craft dashboards with just the right and most important metrics. Share those openly (e.g. as a PDF) with your team.
Build an office dashboard:
Placing your analytics front and center within your office sparks a lot of interest and fosters conversations
Celebrate achievements:
Recognize and celebrate milestones and achievements proven by data. Data is facts. Its your best source of truth.